Ismael Balafrej
  • Posts
  • Publications

Unexpected coin flip experiment

simulation
statistics
In this post, I explore a seemingly straightforward coin flip game between two players. Interestingly, the intuitive approach fails when validated with a Monte Carlo simulation.
Author

Ismael Balafrej

Published

March 20, 2024

Interesting idea from this X post by @littmath:

Flip a fair coin 100 times—it gives a sequence of heads (H) and tails (T). For each HH in the sequence of flips, Alice gets a point; for each HT, Bob does, so e.g. for the sequence THHHT Alice gets 2 points and Bob gets 1 point. Who is most likely to win?

If we pause to analyze, it might initially seem that Alice has the upper hand. Consider a perfect scenario: if the sequence were all heads (HHHHHHHHHH), Alice could rack up to 9 points out of 10 flips. On the flip side (pun intended), in a mixed sequence like HTHTHTHTHT, Bob would only manage to score 5 points out of 10. This reasoning suggests Alice might have a better chance of winning, right?

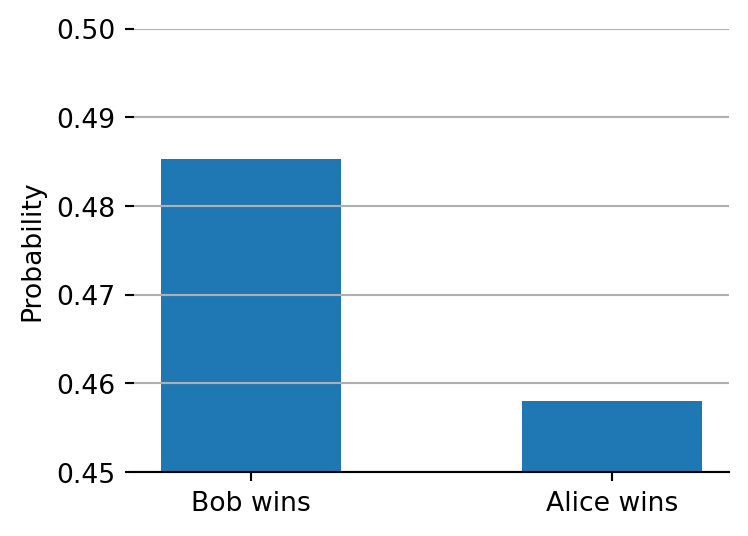
But here’s where it gets intriguing. By conducting a Monte Carlo simulation with N=1M iterations, we uncover a surprising truth: Bob is actually more likely to win:

Code
import numpy as np
import matplotlib.pyplot as plt

np.random.seed(0x1B)
N = 1_000_000
bob_wins = 0
alice_wins = 0

for i in range(N):
    flips = np.random.randint(0, 2, size=100)  # 0: head, 1: tail
    flips_diff = np.diff(flips)  # 1 for TH, -1 for HT, 0 otherwise
    points_alice = np.sum((flips_diff == 0) & (flips[:-1] == 0))  # HH
    points_bob = np.sum(flips_diff == -1)  # HT
    if points_bob > points_alice:
        bob_wins += 1
    elif points_bob < points_alice:
        alice_wins += 1

fig, ax = plt.subplots(figsize=(4, 3))
ax.bar(
    ["Bob wins", "Alice wins"],
    [bob_wins / N, alice_wins / N],
    0.5,
)
ax.set_ylabel("Probability")
ax.set_ylim([0.45, 0.5])
ax.spines['top'].set_visible(False)
ax.spines['right'].set_visible(False)
ax.spines['left'].set_visible(False)
ax.grid(axis='y')
pass

Probability of winning the coin-pair flip game for Bob and Alice.

The nuance here is that Alice might have the potential to score more points in a single game, but when we look at the bigger picture, Bob wins more frequently. Let’s enumerate all possible outcomes with just 4 coin flips to understand why:

Code
from IPython.display import Markdown
from itertools import product

md = f"""
| Flips | Points Alice | Points Bob | Winner | 
|-------|--------------|------------|--------|
"""

for l in product("TH", repeat=4):
    flips = "".join(l)
    points_alice = points_bob = 0
    for pair in zip(flips[:-1], flips[1:]):
        if pair == ("H", "H"):
            points_alice += 1
        elif pair == ("H", "T"):
            points_bob += 1
    winner = "Draw"
    if points_alice > points_bob:
        winner = "Alice"
    elif points_alice < points_bob:
        winner = "Bob"
    md += f"| {flips} | {points_alice} | {points_bob} | {winner} |\n"

Markdown(md)
Flips Points Alice Points Bob Winner
TTTT 0 0 Draw
TTTH 0 0 Draw
TTHT 0 1 Bob
TTHH 1 0 Alice
THTT 0 1 Bob
THTH 0 1 Bob
THHT 1 1 Draw
THHH 2 0 Alice
HTTT 0 1 Bob
HTTH 0 1 Bob
HTHT 0 2 Bob
HTHH 1 1 Draw
HHTT 1 1 Draw
HHTH 1 1 Draw
HHHT 2 1 Alice
HHHH 3 0 Alice

This detailed breakdown showcases Bob’s advantage, who wins more often than Alice in this simplified scenario. The total number of points in all games for both Alice and Bob is equal, 12. Yet, Bob wins more often by a small margin. This exploration not only demonstrates the surprising outcomes that can emerge from seemingly straightforward situations but also highlights the beauty of Monte Carlo simulations in revealing the unexpected.

Citation

BibTeX citation:
@online{balafrej2024,
  author = {Balafrej, Ismael},
  title = {Unexpected Coin Flip Experiment},
  date = {2024-03-20},
  url = {https://ibalafrej.com/posts/2023-03-20.html},
  langid = {en}
}
For attribution, please cite this work as:
Balafrej, Ismael. 2024. “Unexpected Coin Flip Experiment.” March 20, 2024. https://ibalafrej.com/posts/2023-03-20.html.